Gnuplot Line Styles for Display and Printing
August 22, 2014
 I use Gnuplot a lot in my research for generating various kinds of
plots. Usually, some work is needed to find line style settings that
are suitable for both display (e.g., for reading on screen) and
printing (e.g., for publication in an academic journal). Colored
lines may be easier to interpret on screen but may not print well.
Grayscale lines print well but may not work as well on screen.
Sometimes, a good compromise is to use combinations of color and line
style (dotted lines, dashed lines, etc.) to make a graph suitable for
viewing on screen or in print. Other times, it’s best to create two
graphs: a color figure for display and a monochrome figure for
printing.
I use Gnuplot a lot in my research for generating various kinds of
plots. Usually, some work is needed to find line style settings that
are suitable for both display (e.g., for reading on screen) and
printing (e.g., for publication in an academic journal). Colored
lines may be easier to interpret on screen but may not print well.
Grayscale lines print well but may not work as well on screen.
Sometimes, a good compromise is to use combinations of color and line
style (dotted lines, dashed lines, etc.) to make a graph suitable for
viewing on screen or in print. Other times, it’s best to create two
graphs: a color figure for display and a monochrome figure for
printing.
This problem is clearly not specific to Gnuplot, rather, one encounters it in Matlab, Stata, and other similar software packages. Yet, Gnuplot is a cross-platform package that is widely compatible with many operating systems and capable of producing graphics in myriad formats. As such, the specific line styles, fill patterns, etc. that are available are not well documented.
In the past, I’ve resigned myself to naïvely experimenting with line
style numbers until I find the right one for, say, dash-dot lines.
Was it linestyle 2 or linestyle 4? In theory, this number can be
different for different output formats (say, EPS and PDF). Trial and
error can become tedious but searching and reading documentation
didn’t seem helpful.
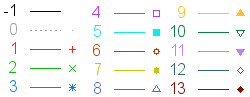
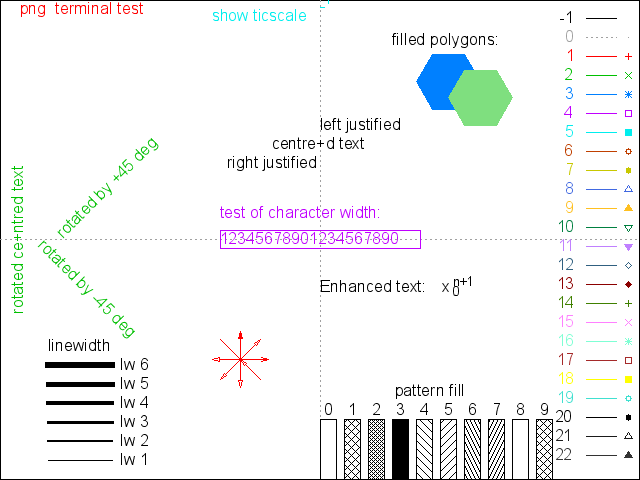
I’ve since discovered that Gnuplot can generate a test page,
reminiscent of a printer test page, that produces the available fill
patterns, line styles, and line markers and provides a sample of line
widths, rotations and other enhancements. To produce it, simply
declare your terminal type and issue the test command like so:
set term pdf enhanced
set output lines.pdf
test
My system is running Mac OS X 10.9 with Gnuplot 4.6 installed from MacPorts. Here are the test pages produced using several different terminals (eps and epslatex output has been converted to PDF for viewing):
See the gnuplot script and the shell script which produced the
above files for details. Also note that pdf and eps terminals are
technically called pdfcairo and epscairo on my machine. On
different platforms, the output may vary.