spark: A LaTeX Sparkline Package
 spark is a LaTeX package for generating sparklines. It is based
on the pstricks package and can only be used with standard (DVI) LaTeX.
There is a similar package for PDFLaTeX called
sparklines, written by Andreas Löffler.
Sparklines, as described by Edward Tufte, are compact word-like graphics which summarize a potentially large series of data. In many cases quick visual inspection of a sparkline can be more effective than reading numbers in a table.
Usage
There is no official documentation yet, but the fastest way to learn to use
spark is probably to look at a few examples. Simply put the spark.sty file
in the same directory as your LaTeX document and add \usepackage{spark} to
the top of the file.
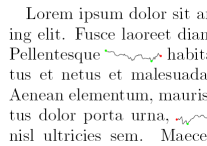
In the image above, the first continuous sparkline was generated by:
\sparkalldots
\sparkscale=0.15pt
\sparkhskip=1
\sparkymin=1225pt
\lspark{1302.15, 1295.29, 1293.97, 1292.39, 1291.40, 1289.82,
  1294.44, 1295.51, 1293.57, 1292.71, 1285.27, 1268.19, 1266.67,
  1262.08, 1261.30, 1264.73, 1268.37, 1273.00, 1273.82, 1271.25,
  1270.73, 1265.71, 1274.31, 1263.15, 1261.92, 1261.94, 1257.19,
  1249.13, 1236.74, 1224.54, 1231.49, 1228.45, 1241.43, 1257.29,
  1259.65, 1264.46, 1263.13, 1270.58, 1265.91, 1270.06, 1270.20,
  1245.94, 1237.59, 1238.94, 1243.68, 1241.43, 1241.53, 1240.09,
  1238.87, 1237.17, 1246.33, 1230.01, 1219.29, 1222.52, 1236.43,
  1250.03, 1235.18, 1255.77, 1254.46, 1264.66, 1280.22, 1269.19,
  1259.38, 1259.87}
The \sparkalldots directive tells the package to render dots at the
beginning, end, minimum, and maximim. \sparkscale is the ratio of points to
data units, the \sparkymin option specifies the y-axis value that will be
aligned with the bottom of the line of text. The data here are all above
1225, so that used as the y-axis offset.
The first bar-sparkline was rendered using:
\sparklinewidth=0.2pt
\sparkhskip=4
\sparkscale=125pt
\sparkunit=0.5pt
\sparkymin=0pt
\dspark{0.007, 0.036, 0.025, 0.083, 0.031, 0.08, 0.075, 0.081,
0.03, 0.076, 0.076, 0.09, 0.081, 0.085, 0.126, 0.018}
Note that the options only need to be specified once if all the data have the same scale. The data in the above two examples are of very different magnitudes, requiring different scaling.
You can create a PDF file as usual using latex, dvips, and ps2pdf. For
example, the file spark.pdf below was created as follows:
$ latex spark.tex
$ dvips -o spark.ps spark.dvi
$ ps2pdf spark.ps spark.pdf