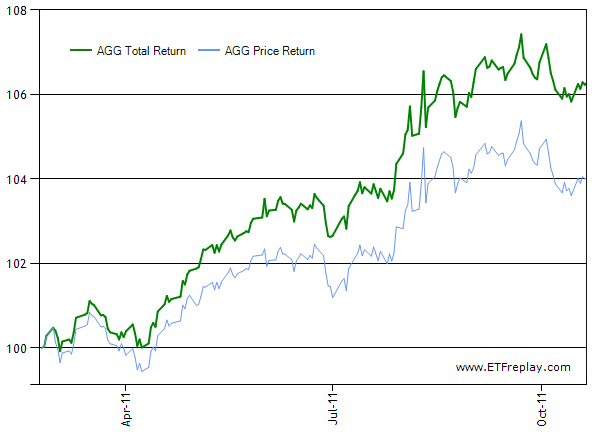
Price Return vs. Total Return
February 24, 2012
The vast majority of financial tools available on the internet do not seem to report total returns, but rather only price returns. For example, when you plot the relative performance of two mutual funds or exchange-traded funds (ETFs), only the price history of the two assets is compared, excluding any dividends received (whether reinvested or not). This is a huge deficiency when comparing funds containing a large fraction of bonds, for which such distributions are typically more important than for stocks.
Luckily, ETFreplay has created a nice comparison tool which calculates and plots these two measures. For example, for the iShares Barclays Aggregate Bond (AGG) over the last year, the total return (with dividend reinvestment) was 8.6% while the price return was only 5.2%—a difference of over 3%.
